Discovering New Space Anomalies With AI
Earlier this year, we learned about how AI is used for space exploration. However, the space industry is certainly very exciting, and all of the new innovations and developments in technology pave the way for a new exploration of uncharted territories and potentially even uncover new phenomena. AI is already being used by NASA to automate image analysis for the galaxy, planet, or star classification, but recently researchers at HSE University found a new application for AI in space exploration: uncovering anomalies. In this article, we will take a look at this new ML technology and the data annotation necessary to create it.
Detecting Space Anomalies Manually
Believe it or not, there is actually an international team of researchers from the Sternberg astronomical institute, Laboratoire de Physique de Clermont, Space Research Institute, and the University of Illinois Urbana-Champaign who joined together to solve the problem of detecting unusual objects in astronomical databases with machine learning methods. One of the approaches they use to detect anomalies is called “nearest neighbor” and uses a k-D tree to analyze digital images such as those of the Northern sky collected in 2018. A k-D tree is a geometric data structure for breaking space into smaller pieces using hyperplanes, planes, lines, or points.
The majority of astronomical discoveries have relied on initial observations and later calculations. Even though there were relatively few observations made overall in the 20th century, the introduction of extensive astronomical surveys significantly increased the amount of data available. The SNAD team realized that manually analyzing such massive volumes of data would be expensive and time-consuming, so they decided to build an automated solution.
Leveraging Machine Learning to Detect Anomalies
Since analyzing all of the images manually would be extremely time-consuming, they decided to automate the process with machine learning. To train the machine learning system, they needed to input annotated training data that contained exactly what the system needed to look for. When analyzing astronomical objects, scientists look at their light curves, which depict changes in an object’s brightness over time. The observers first see a flash of light and then observe it to see if the light gets brighter, weaker, or disappears altogether.
The next step was to create various simulations using characteristics they would expect to observe in real astronomical bodies. A training dataset of approximately a million objects were fed into the system in hopes of finding super-powerful supernovae, Type 1a and Type II supernovae, and tidal disruption events. Such classes of objects are referred to as anomalies. They are either very rare, with little-known properties, or appear interesting enough to merit further study.
The k-D tree approach was then used to compare the light curve data from simulations to that from real objects. This technique was utilized in the current study to focus the search area while seeking actual items with characteristics that corresponded to those in the seven simulations.
The team then found 15 nearest neighbors, or actual items from the ZTF database, for each simulation — a total of 105 matches — which they then visually inspected to look for irregularities. Thanks to this approach, the researchers were able to detect eleven anomalies that were confirmed by human verification, of which seven were supernova candidates, and four were candidates for active galactic centers where tidal disruption events could occur.
What Types of Data Annotation Are Necessary to Create Such a Technology?
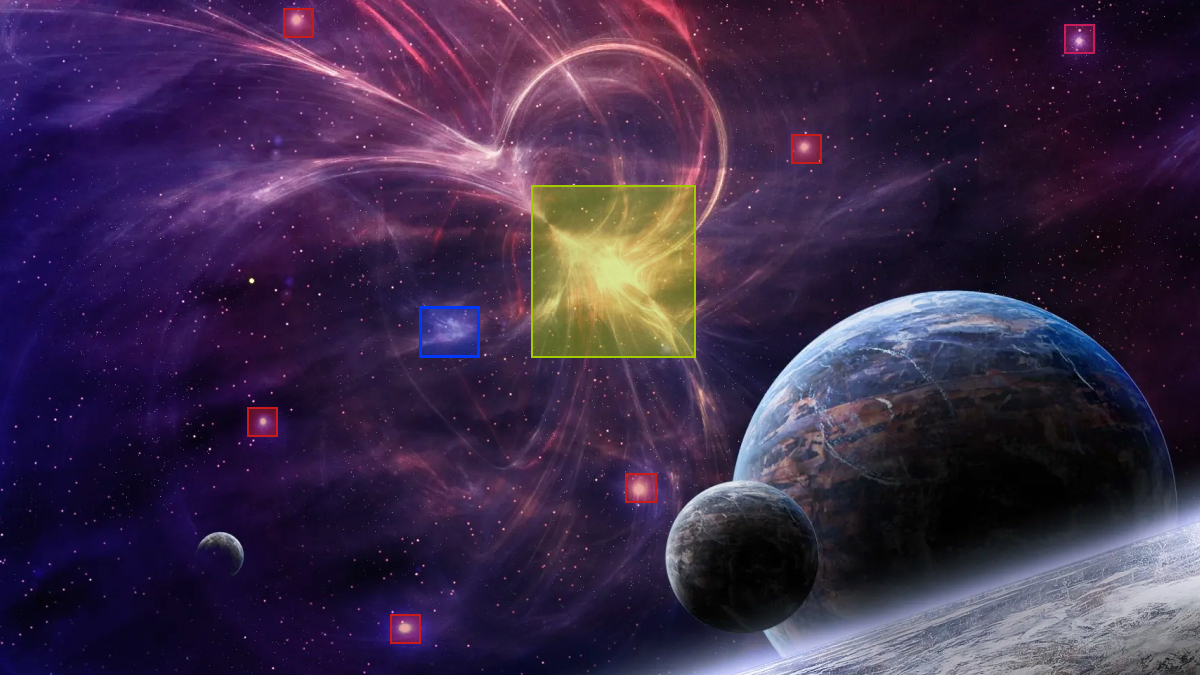
In the previous section, we talked about some of the things researchers look for in the training dataset of images, i.e., light curves, changes in object brightness, etc. All of these things would need to be annotated, first of all, by tagging the flash in the sky, or the object could be contoured with polygon annotation. Then they would need to annotate the change in brightness. This could be done by color coding the distances the same way it is done on a 3D Point Cloud. Basically, fading light could be annotated in blue while more bright in red since there are more photons per second.
Trust Mindy Support With All of Your Data Annotation Needs
Mindy Support is a global company for data annotation and business process outsourcing, trusted by several Fortune 500 and GAFAM companies, as well as innovative startups. With nine years of experience under our belt and offices and representatives in Cyprus, Poland, Romania, The Netherlands, India, and Ukraine, Mindy Support’s team now stands strong with 2000+ professionals helping companies with their most advanced data annotation challenges.